 NativTap
Before you begin
- Times follow your store's time zone. Money uses your store's currency.
- Installs come from App Store Connect sales reports when your key can read them and your Vendor number is saved in Nativtap > Settings > Apple account. Otherwise Installs counts devices that opened your app for the first time.
- Apple publishes its reports with a delay, so the latest days of Installs can be missing.
Choose a period
- From your Shopify admin, go to Nativtap > Analytics.
- Select the date button at the top. It shows Last 30 days when the page opens.
- Choose Today, Last 7 days, Last 30 days, Last 90 days or Custom. For Custom, pick the first and last day on the calendar.
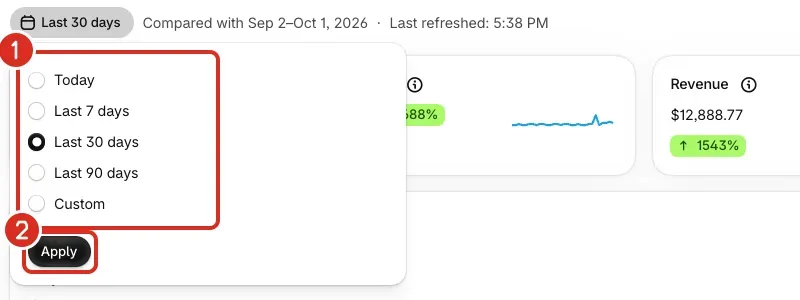
1: The ranges you can pick. 2: Apply. - Select Apply.
The three Last periods are whole days that end yesterday, so today is not in them. A custom period can be up to 366 days. The text beside the date button names the earlier period of the same length that your numbers are compared with.
Read your numbers
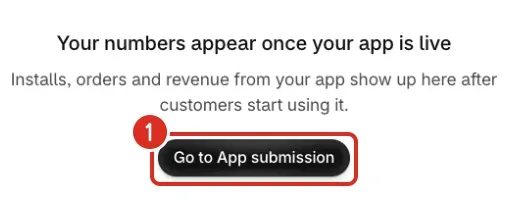
While your app is not live and has no orders or app activity yet, the page says "Your numbers appear once your app is live". Select Go to App submission to see what is left before release.
- Read the four cards at the top: Sessions, Orders, Revenue and Conversion rate.

1: Date range. 2: One number card. Point at its info icon to read what it counts; the badge shows the change compared with the previous period. - Read the percentage badge beside a number. It shows the change against the earlier period. A drop is not shown in red.
- Point at the info icon (i) on a card to read what it counts.

Orders and revenue update within minutes. App usage (sessions, installs, push opens) refreshes every 12 hours; click Refresh to get the latest. The text Last refreshed beside the date button says when app usage was last loaded. It says Not refreshed yet before the first load.
Understand each number
- Orders: orders placed in your app. Cancelled orders are not counted. Later edits to an order are not reflected.
- Revenue: the total value of orders placed in your app, in your store's currency, before refunds.
- Average order value: revenue divided by orders.
- Conversion rate: orders divided by sessions.
- Installs: first-time downloads of your app, from App Store Connect sales reports. When no report is available, devices that opened your app for the first time.
- Sessions: the times your app was opened. Opening it again after 30 minutes in the background starts a new session.
- Push opens: the times shoppers opened your app from a push notification.
- Revenue from push: revenue from orders placed within 24 hours after a shopper last opened a push notification.
Charts and the conversion funnel
- Each chart draws one number over the period, with the earlier period for comparison. Point at a chart to read the value for a day. A period longer than 92 days is drawn by week.
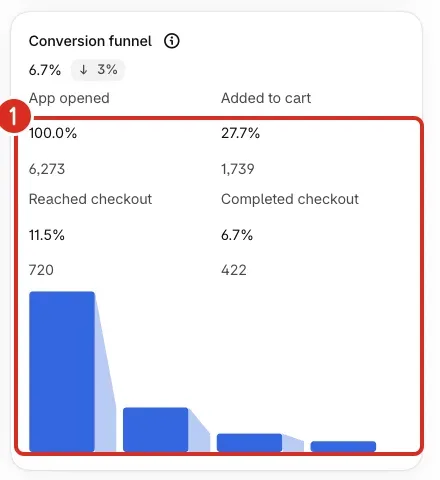
- The Conversion funnel shows four steps: App opened, Added to cart, Reached checkout and Completed checkout. Each step shows its share of the first step and its number of devices.
- A device is counted once per day, so a device that opens your app on two days counts twice.
- The Sales breakdown lists Orders, Revenue, Average order value and Revenue from push for the period.
Common problems
- The page says "Your numbers appear once your app is live"
- Your app is not live yet and Nativtap has no orders or app activity to show. Select Go to App submission to see the steps that are left.
- A banner says "Some numbers are updating"
- Installs, sessions and push opens will be back in a few minutes. Orders and revenue are up to date.
- A banner says "Couldn't refresh app usage"
- The last refresh of app usage did not finish. It refreshes again automatically within 12 hours, or you can select Refresh to try now. Orders and revenue are up to date.
- A card shows "Updating"
- Nativtap can't read that number right now. Reload the page later.
- A chart says "Click Refresh to load app usage"
- App usage has not been loaded for your store yet. Select Refresh at the top of the page.
- A chart says "Choose 2 days or more to see a chart"
- Today is a single day. Choose Last 7 days or a longer period.
- Refresh says "Refreshed N min ago. Try again in M min."
- Refresh was used a short while ago. N and M are the minutes shown in the message. Wait that long, then select Refresh again.
- Conversion rate shows a dash
- The period has no sessions to divide by. Choose a longer period, or select Refresh if app usage has not been loaded.
- Installs says "Showing new devices until App Store Connect reports are available"
- Apple's sales reports are not available yet, so Installs counts devices that opened your app for the first time. If it stays, check that your Vendor number is saved under Nativtap > Settings > Apple account > App Store app.
- Installs says "Apple data through" and a date
- Apple's reports stop at that date, so the last days of your period are not in Installs yet. They are added when Apple publishes them.
- Installs says "Showing new devices. Your App Store Connect key can't read sales reports."
- Apple answered that your key has no access to sales reports (a 403 error), so Installs keeps counting devices that opened your app for the first time. Ask the Account Holder to check the key's access to reports in App Store Connect, under Users and Access. Apple lists which roles can view sales and trends on its roles page.
- A card says "Only orders in USD are included"
- The card adds up only orders placed in your store's currency, and the note shows that currency code. The Orders card counts orders in every currency.
Related
Something wrong or out of date on this page? Tell us by email.
Still stuck?
Send us the exact message you see, and what you already tried.